Today we are talking about how to use Pinterest pin statistics to improve your marketing strategy. We’ve talked about this topic several times before on the podcast (e.g., Why Pinterest Analytics Should be Defining Your Strategy and Understanding Pinterest Analytics) . But Pinterest seems to be in a constant state of flux when it comes to its stats.
Let’s just say that this constant state of flux makes it important for you to stay on top of the latest information. So, we’re going to unpack some of these latest Pinterest stats and get to the heart of what you need to know.
Before we get into that, I have some exciting news for our eCommerce listeners here at Simple Pin Media! We’ve been listening and we hear your pain points, so…
We’ve created a new eCommerce Kickstarter package!
This awesome new package is a hybrid of management and consulting.
It’s a 6-week program bringing together your eCommerce goals, our image team, and a dedicated account specialist focused on your specialty to advise you on shop integrations and more.
We’re ready to give you that kick-start your Pinterest marketing needs!
While you’re on our site, you can check out all of our other services including our new consult calls. We know that you have specific needs for your business industry, so we have targeted our calls to your specific needs:
We are a Pinterest marketing agency with a full suite of services. We’ve worked with over 700 Pinterest accounts, managing billions of monthly Pinterest impressions and millions of Pinterest sessions for our clients each month.
We want to help you reach your goals!
Let’s dive into Pinterest stats.
Various Pinterest pin statistics have come and gone over the years and the analytics dashboard has improved. Pinterest has expanded and updated its library of terms to give you more details than what was available just a couple of years ago. But many of you are still left wondering what you are looking at and what each number means.
This is especially true if you are new to Pinterest.
Today, we’re going to dive into the Pinterest analytics dashboard, talk about what you will see, give you some definitions, and provide you with some action items.
Before We Get Started
There are a few things to keep in mind when looking at Pinterest stats:
- Features and their associated analytics vary by format (standard pin, video pin, Idea pin, etc.) and what is available in your home country.
- To view pin stats, you’ll need to have a business account. It’s free, super easy to set up. You’ll need one to view the insights we are discussing today. It’s also against the Pinterest terms of service to operate with a personal Pinterest account if you are selling something.
- To see stats for pins created by others from your website, make sure you claim your website on Pinterest. You can also claim your Instagram, Etsy, and YouTube accounts.
I recommend referring to Pinterest’s detailed glossary of current Pinterest metrics if there is a particular metric that is unclear or confusing.
Using Pinterest Pin Statistics to Inform Your Pinterest Strategy
Pinterest stats provide loads of information, including WHO is interacting with your pins, clicking on them, saving them, and buying from Pinterest. If you can drill down to understand that, then you’ve reached a place where you can continue the conversation with the person that you’re interacting with.
First, let’s understand what’s inside the Pinterest Analytics Dashboard.
The Pinterest Analytics Dashboard
When you open up your Pinterest account (on desktop) you’ll see a tab for Analytics. On the little drop-down menu you’ll find the following options:
- OVERVIEW
- AUDIENCE INSIGHTS
- CONVERSION INSIGHTS
- VIDEO
- TRENDS
There’s a lot on the analytics dashboard that you can go deep on, but we’re just going to start with the OVERVIEW option. Let’s walk through it together.
When you click on the OVERVIEW option, you’re going to be presented with a lot of choices on the left-hand side of the screen. When you see a little grey dot with an “i” in the middle of it, you can hover over that and it will give more detail about what that term means.
As you look down the left side, you can click on many different filters to sort your data (e.g., DATE RANGE, CONTENT TYPE, DEVICE, FORMAT, etc.).
Under the DATE range, I like to look at data across 30, 60, and 90 days.
Let’s click on 90 days for a bigger picture.
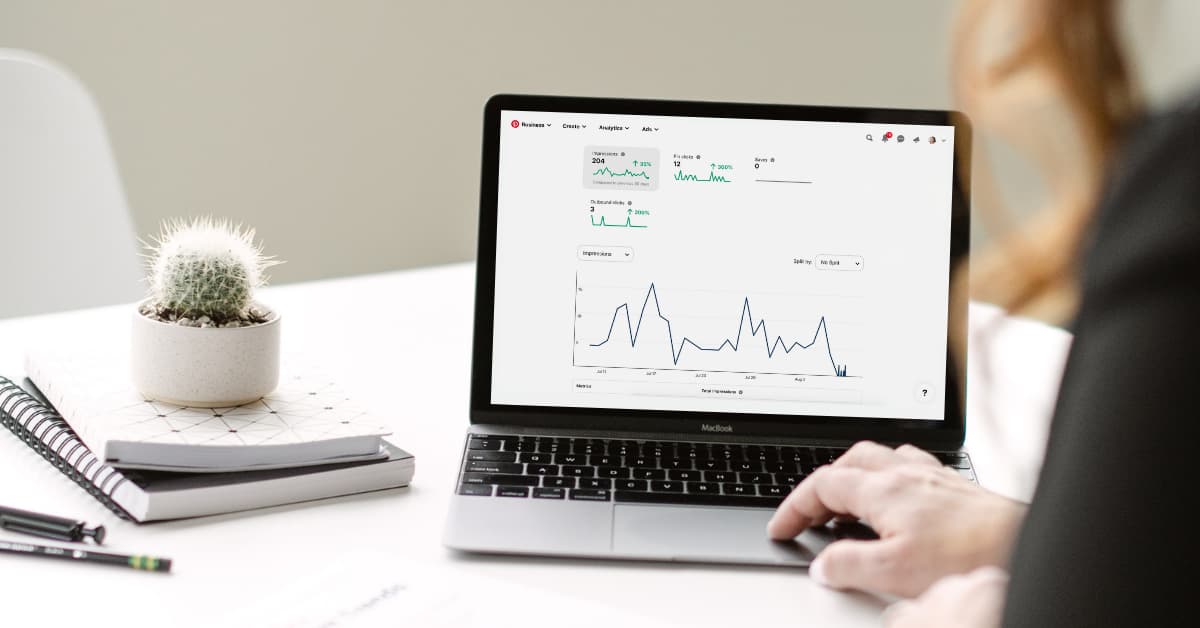
On the right side of the screen, you will now see performance over time. Your stats are always going to default to IMPRESSIONS, but I like to change that to OUTBOUND CLICKS. This pin statistic shows the number of people coming from Pinterest and clicking to my website.
Why do I go there first? Because I want to see who specifically took action.
I love to perform an overall assessment in this way (the 10,000-foot level).
Further down the page, I also select OUTBOUND CLICKS for the Top Pins and Top Board sections. This allows me to see which boards and pins are leading people to my website.
If you’ve been doing Pinterest marketing for some time, your older pins will probably be at the top. If you want to see how your new content is doing specifically, check the option to only include data for “pins created in the last 30 days.”
Now, let’s say you’re leaning into Idea Pins (aka Story Pins) and you want to see if those are working.
I know what you’re thinking – Kate, Idea Pins don’t link so you can’t do outbound clicks.
But here’s what I can learn from looking at my Pinterest pin statistics:
Saves – People are taking action to save it for later because they found it so valuable.
Impressions – People who have seen the pin. If you really want to feel good about yourself you’ll click here. Those numbers will be really pretty because they are super high!
Engagements – People who have engaged with the pin.
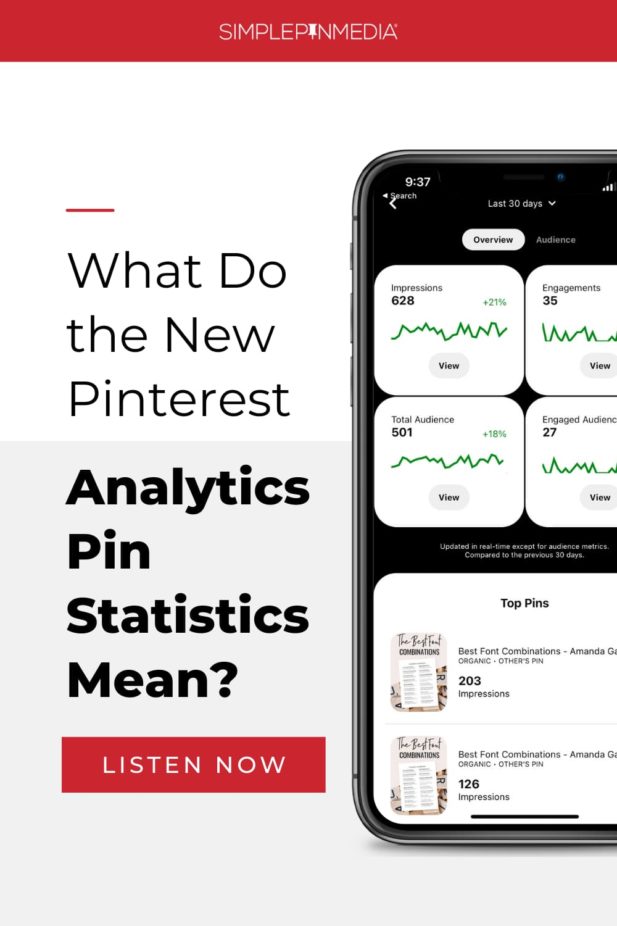
Pin Clicks – People who click on your pins to the content on or off of Pinterest. Pin click rate is total pin clicks divided by total impressions for that pin.
I like to look at these stats to assess what people are clicking on and engaging with so I can consider how to create more of that content.
That’s the biggest takeaway here. Once I understand what people are clicking on and who’s saving my pins, I get some great ideas for content creation or new images I might need to create for my products.
That’s just one small part of the Pinterest analytics data that is available to you. There’s so much to discover in your Pinterest analytics. It’s probably going to take you 20 to 25 minutes just to click around and look at different things.
We have a full, detailed blog post on Pinterest conversion insights too. It’s a little complicated, fairly new, and it does require adding a tag. If you are selling something and you’re using the tag on Pinterest, it is very important to get the tag set up properly on your account so that you can get the right information.
On-Pin Statistics
Alright! Let’s hop out of the Pinterest analytics dashboard and on to what we call on pin stats.
There are a few things you need to note about on-pin stats.
- If you have a personal account and you do have access to idea pins, you might be able to see their stats without having a Pinterest business account or claiming your website.
- On-pin stats are calculated by aggregating the data for all pins that share an image and if applicable, a URL. These stats include data from all the people who have saved content that you created or published or people who have saved content from your site using the Save button, the browser extension, or from somewhere else on Pinterest.
- The pin’s downstream activity (e.g., saves from your Pinterest profile or when someone saves your pin from someone else’s profile) is also included in these statistics.
- If you’ve created a pin, you will see real-time metrics on that pin. Keep in mind that these real-time metrics are estimates and subject to change. As a result, they might decrease.
So when I go to on-pin stats for my idea pins, what am I looking for?
Now I can see:
- Impressions
- Pin Clicks
- Saves
- Number of followers
- Number of profile visits.
Let’s zoom in on one of my most popular Idea pins, How to Clean Up Your Pinterest Boards, to see how my hard work is paying off.
This particular Idea pin has over 237,000 impressions, 4,000 pin clicks, and 990 saves. It was created over a year ago and it’s still showing up. It was created before they changed their stats so I can’t see the follows on this particular pin.
If we look at a newer one, How to Create Pinterest Boards for Your Business, I can see it has 17,000 impressions, 246 pin clicks, 73 saves, and I acquired five followers and 51 profile visits from this Idea pin.
Oftentimes people are coming to my profile and they see some of these Idea pins (or my regular pins) and they click on my URL to go to my website. I know all of this is a little bit hard to track and it’s usually done through Google Analytics with Direct Traffic, but now that we can see these profile visits we can arrive at some conclusions.
When I click on my profile visits, I can see in the last 30 days how many visits have come to my profile from this pin. I can also see the different boards that the pin has been saved to.
This particular Idea pin has been saved to boards titled:
- Educational/Pinterest
- Pinterest Marketing.
The good news is that it hasn’t been saved to any crazy board that is not related to Pinterest. This affirms that I’m getting it right!
With all the information I’ve just gathered about who is interacting with my pin from the Pinterest pin statistics, I can deduce that people still love my how-tos. This means I still need to be creating that type of content because that’s what my analytics data tells me is performing well.
This is what we do when we look at the stats. We have to make some assumptions because Pinterest isn’t telling us everything. They’re not telling us exactly who clicked over to our website, but we can use this information to inform our marketing strategy.
Pinterest Analytics: Action Items
-
- Check all Pinterest stats once a month. Set aside about one hour to assess the numbers.
- Become familiar with the dashboard on Pinterest Analytics and the on-pin stats.
- Take notes on your Pinterest pin statistics.
- Determine what is working and what’s not working.
- If you find that there’s a weird pattern of lows or highs, that could be a Pinterest problem not necessarily a real problem. Check with any Pinterest marketing communities you’re part of. Most will be able to give you communal feedback as to whether they are seeing the same patterns.
Remember, it does take a while to see real results on Pinterest.
If this is a place where you know your readers and buyers hang out, keep investing. This marketing game on Pinterest is a slow burn and the biggest problem is people giving up too soon. So keep at it.
Take those notes on your stats and use them to inspire your content creation and new images. And keep on pinning.
I like to get an overall assessment of things. I like looking for patterns. I can see them pretty easily and I can just keep things in my mind. I’m kind of a 10,000-foot level person.
If that’s not easy for you, create a spreadsheet of what you’re seeing every single month. That’s what we do for our clients. We track anything that’s changed and keep important notes on follower numbers, impression numbers, clicks to the website, and saves.
Those have been our guiding metrics to create a strategy that works well for our clients. They also help us identify problems or shifts on the Pinterest platform.
For Further Listening/Reading:
- Review Pinterest Analytics Tutorial from Pinterest
- Track Pinterest Everything with Google Data Studio
- Why Pinterest Analytics Should Be Defining Your Pinterest Strategy
FREE Download - Getting Started with KPIs Guide

Learn how to track Key Performance Indicators to measure your business success. Download our FREE printable Getting Started with KPIs Guide


I never knew Pinterest Analytics has such a ton of stats.
Thanks, Kate, for showing me the correct way to go about it.
Indeed, your how-tos are the best!
Thanks Affan!